Animated Headline
Water
Efficiency
Diagram illustrating water flow through Evonik's plants, showing sources like rainwater, groundwater, surface water, and seawater, and steps including pretreatment, use in production, cooling processes, and final return to bodies of water.

Infographic

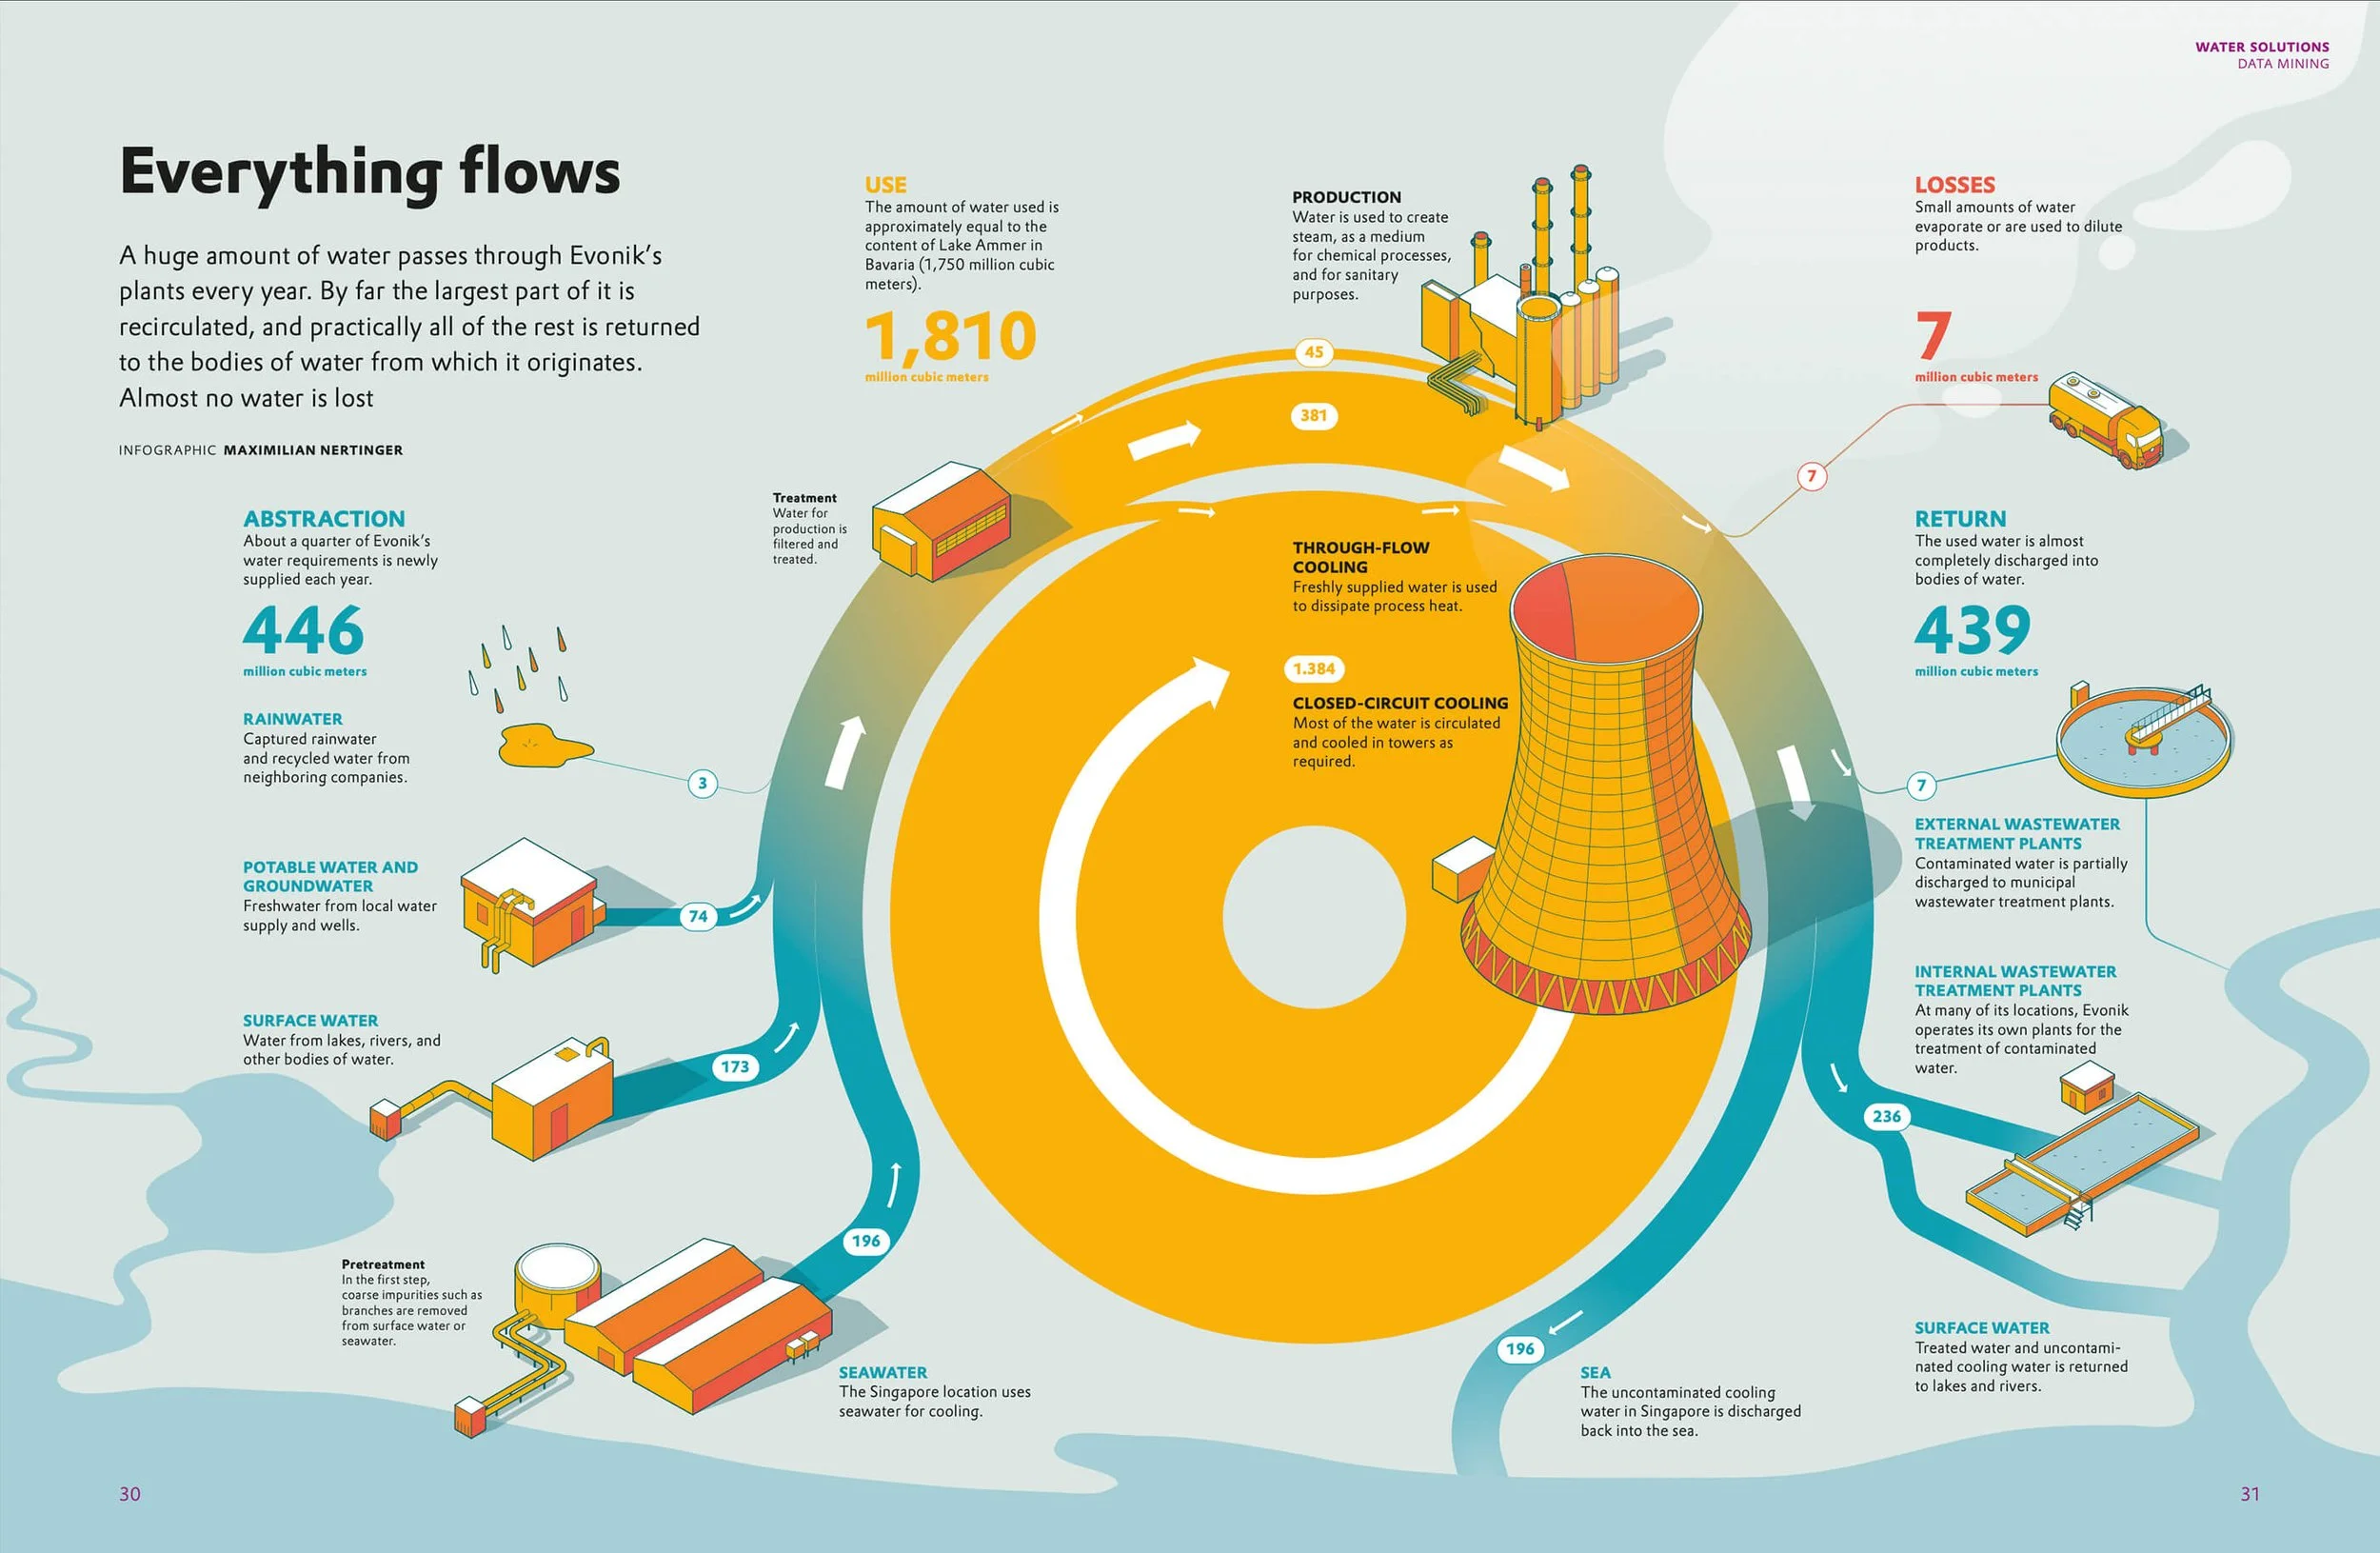
Evonik's facilities process vast amounts of water annually, with the majority circulating in closed loops. Nearly all of the remaining water is returned to its source, minimizing loss and ensuring sustainable water management.
This graphic is based on the actual quantities of processed water and the various stations it runs through. The magazine features additional graphics on water processing.

Client

Evonik

Partner

knskb+

Roles

concept

design

Infographic titled 'Precious Water' showing water distribution and usage statistics worldwide. Features water reserves in top countries with blue water droplet illustrations, statistics on water wastage, water stress by region, and water prices in selected cities.
Schematic diagram of a cooling tower illustrating the path of water and air, featuring components like feed, spray unit, cooling packs, demister, GRP container, floor outlet, air intake, and fan.
Previous
Next