Animated Headline
Information
powerhouse
An overview collage of multiple infographic slides related to Germany, covering topics such as demographics, economy, social issues, and culture, all with visual charts and graphs in a dark background style.

Infographic editor

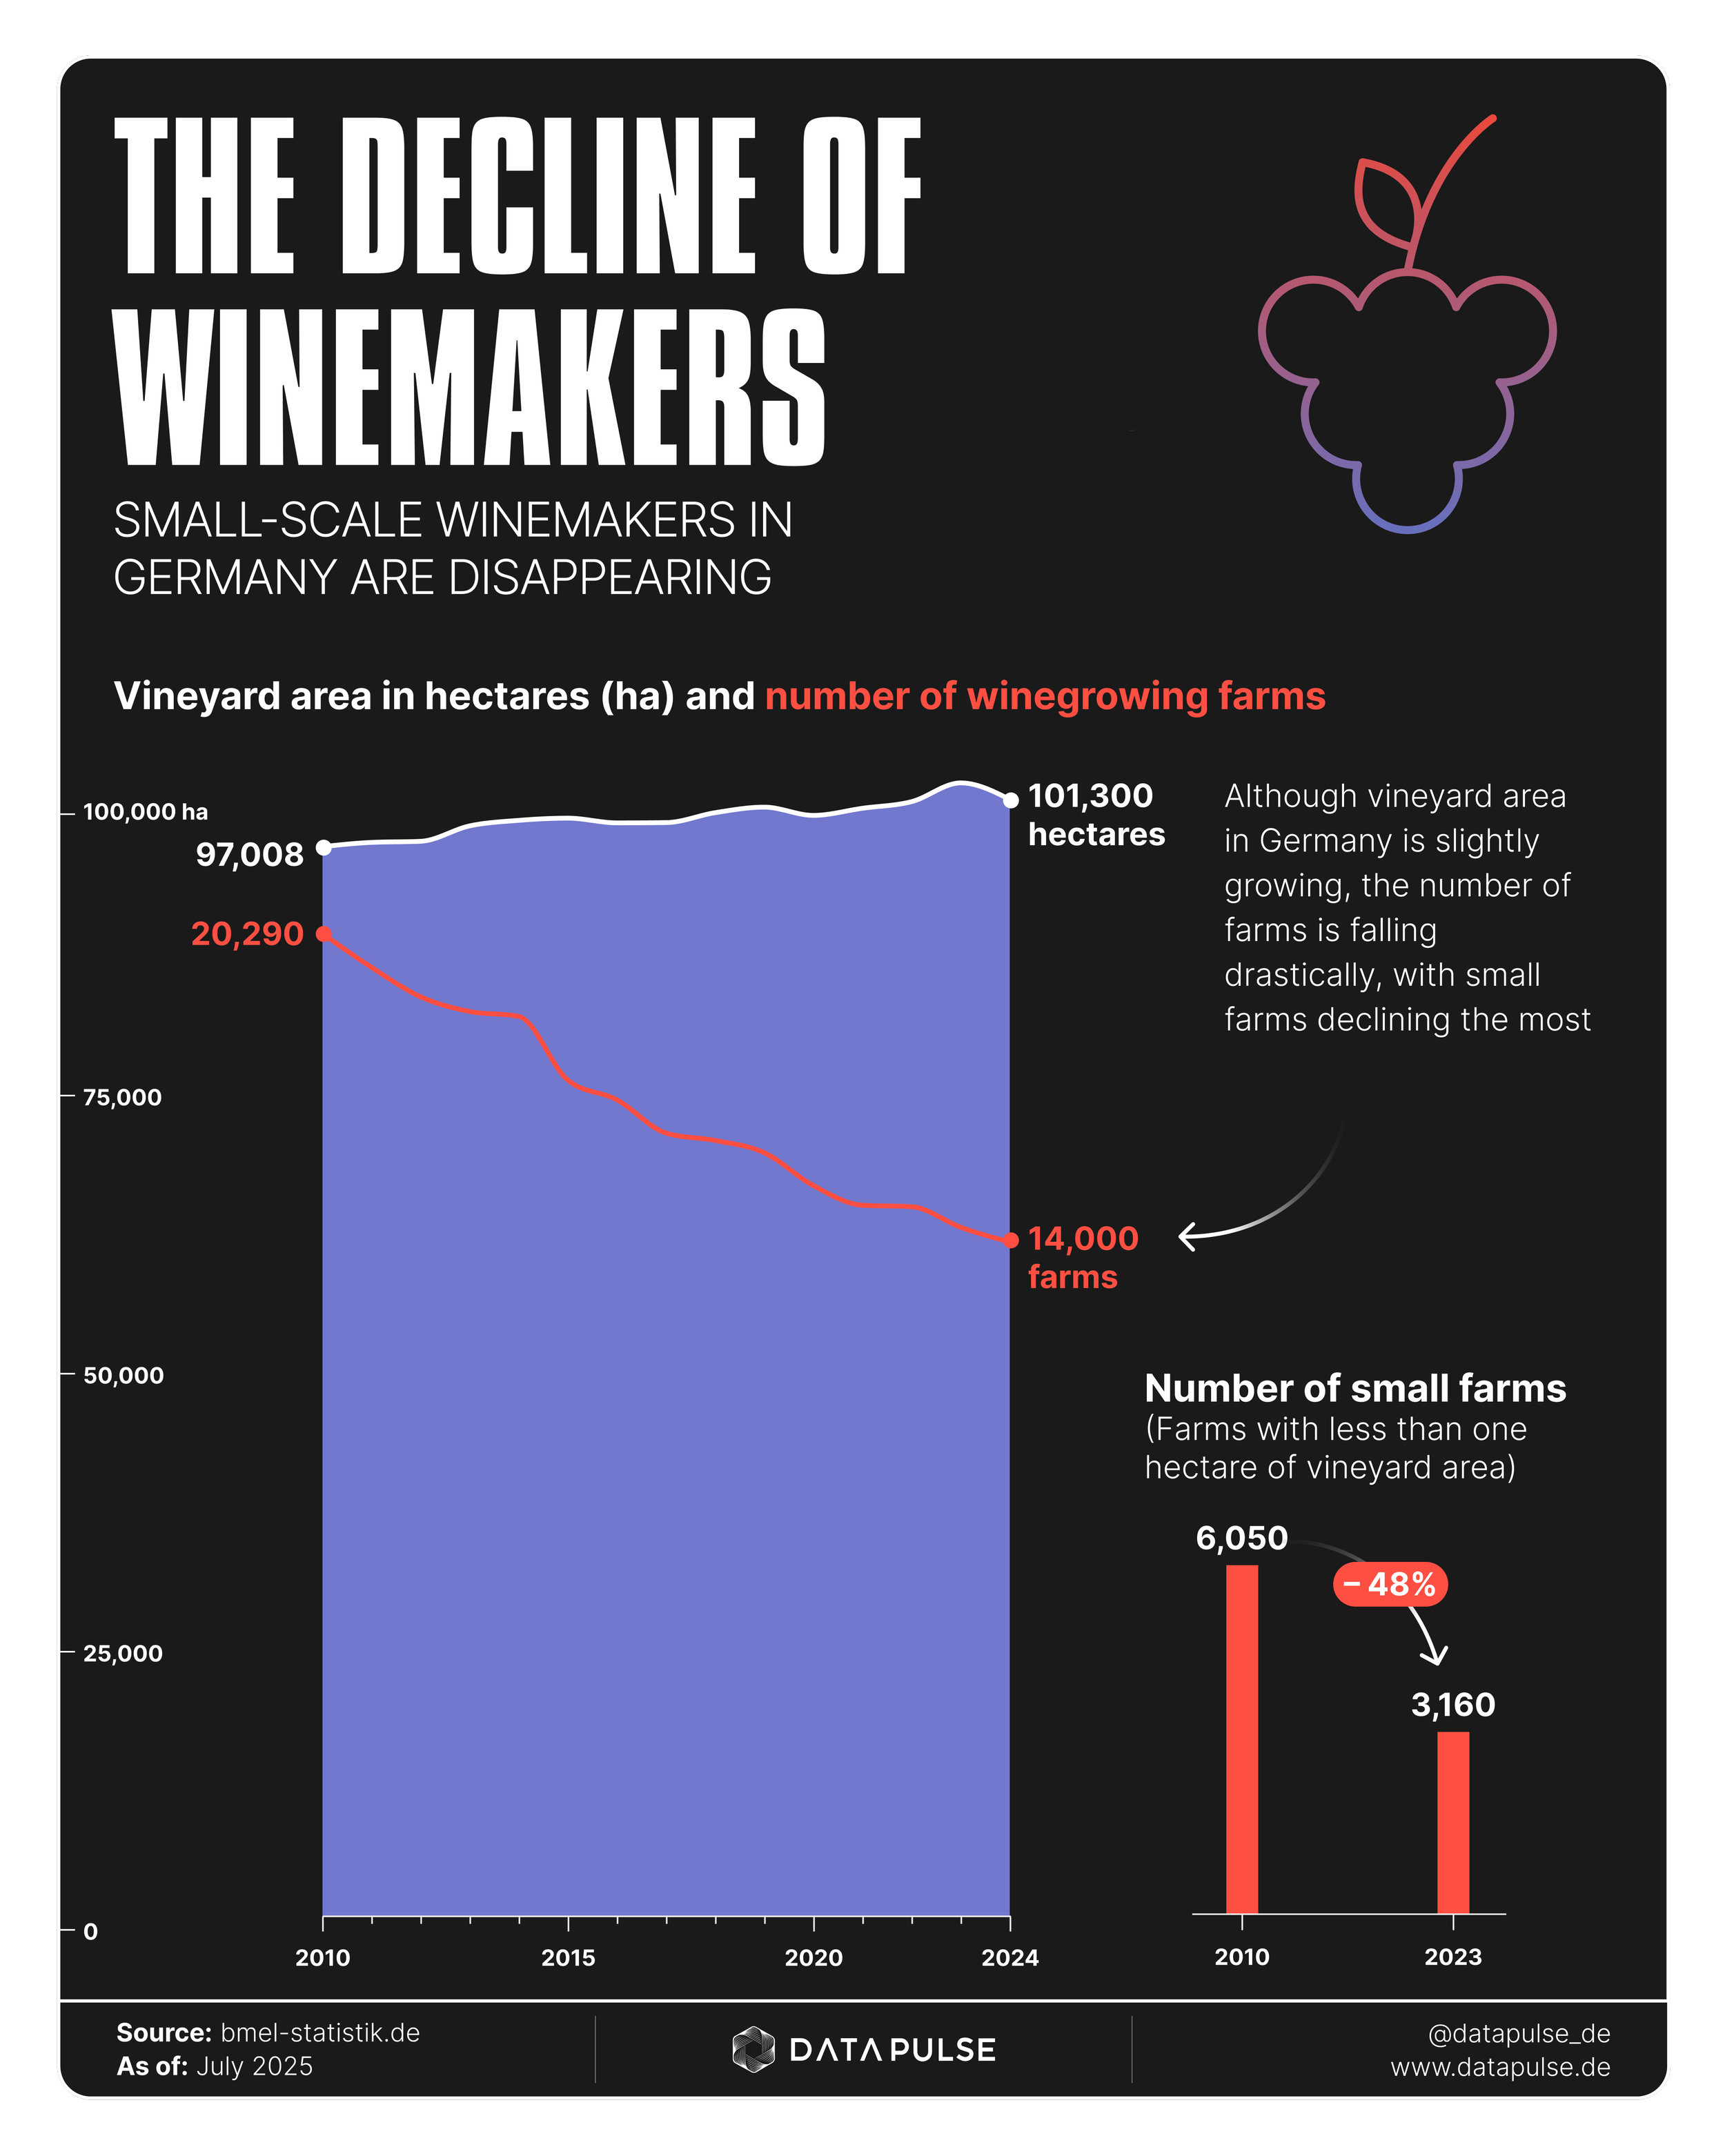
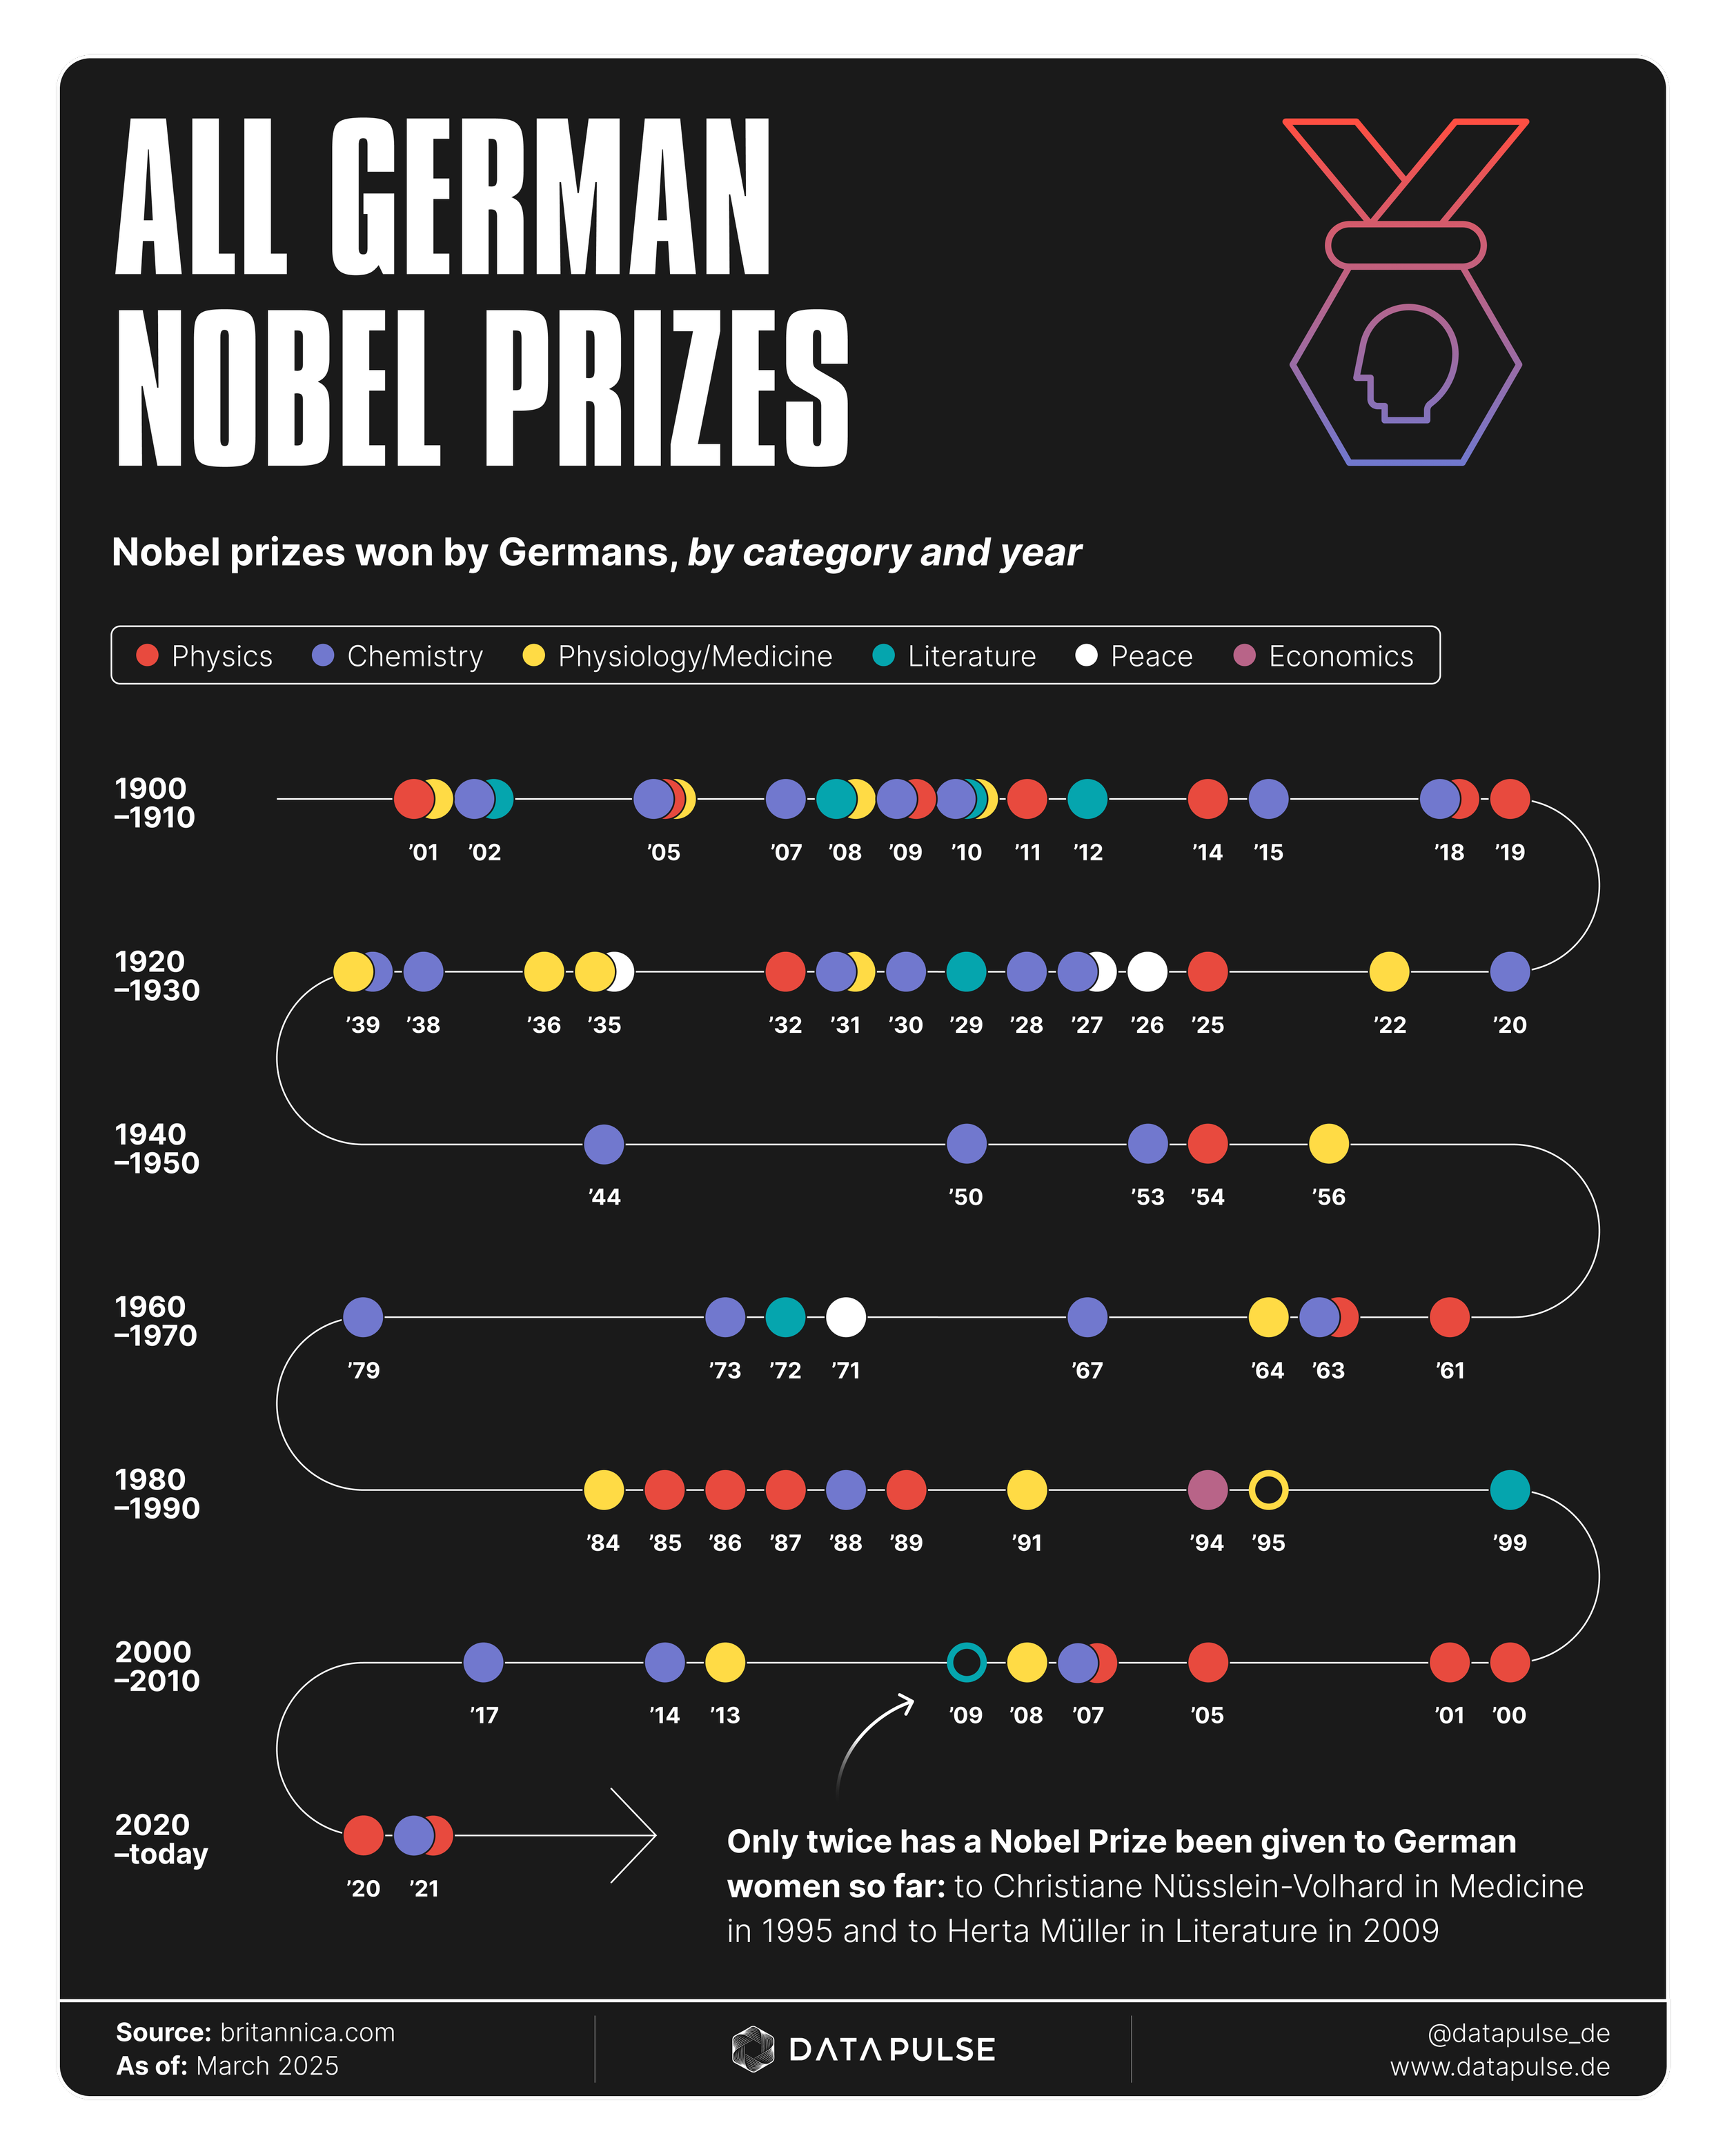
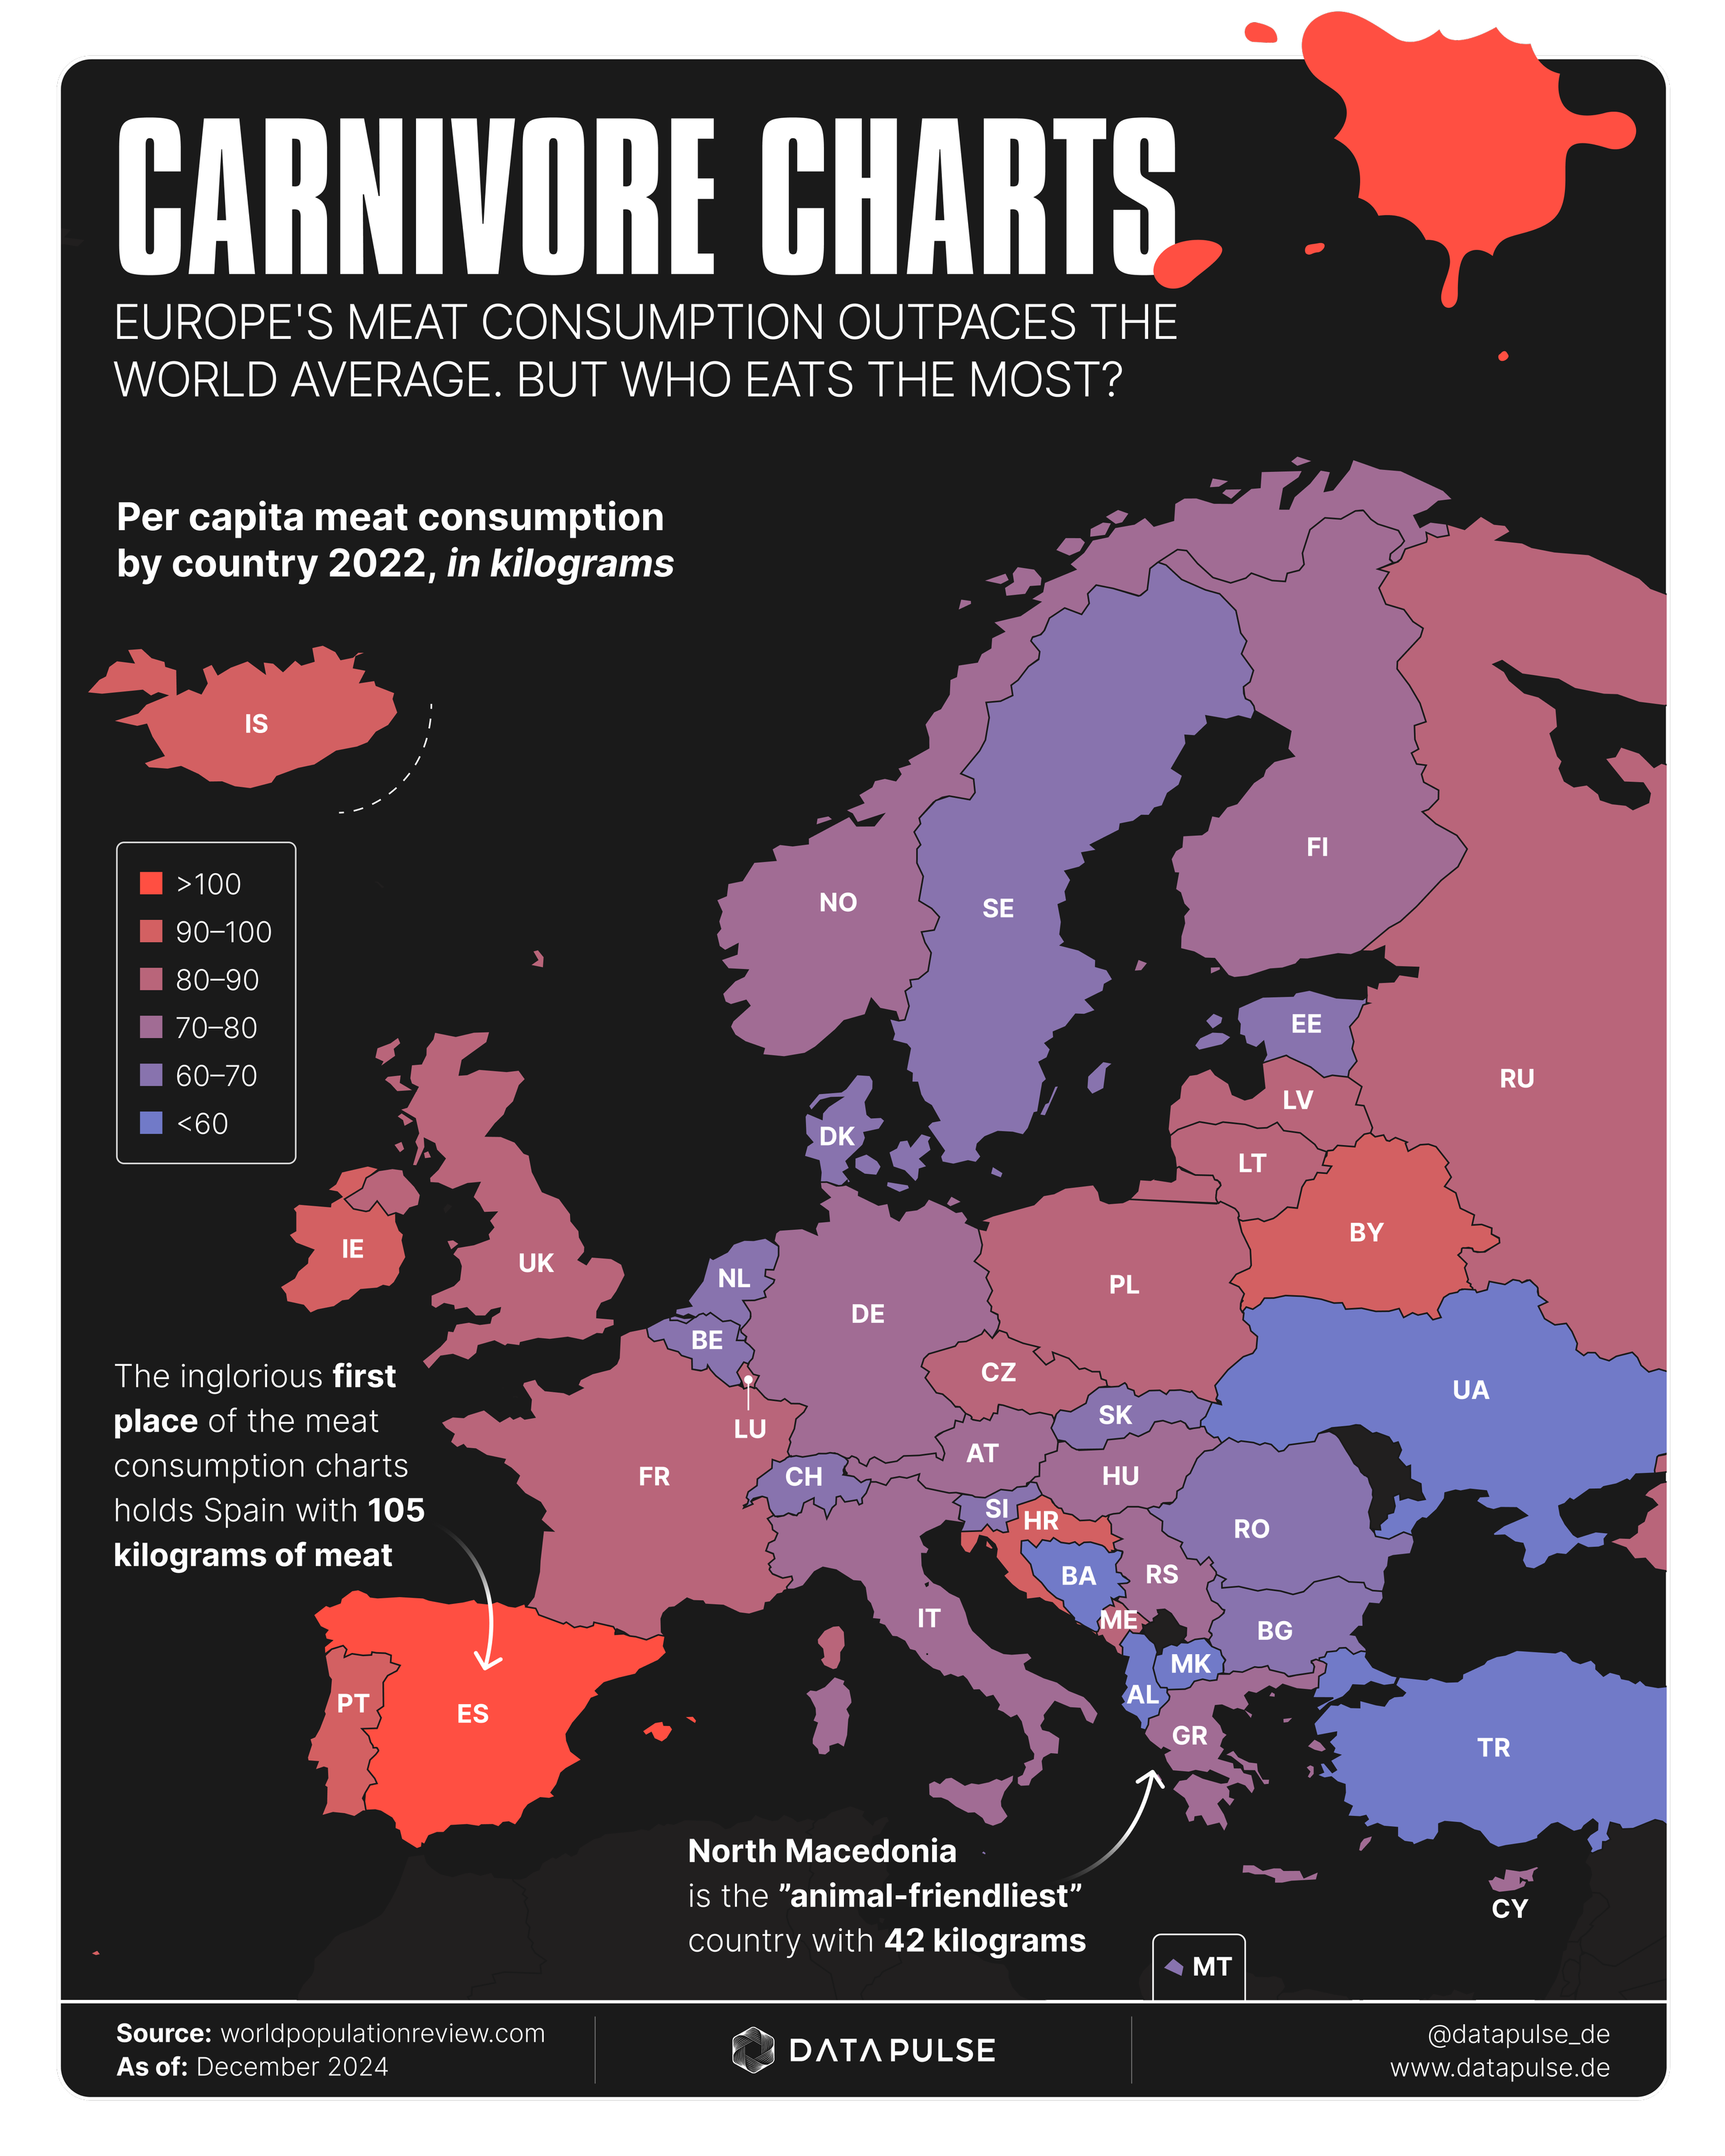
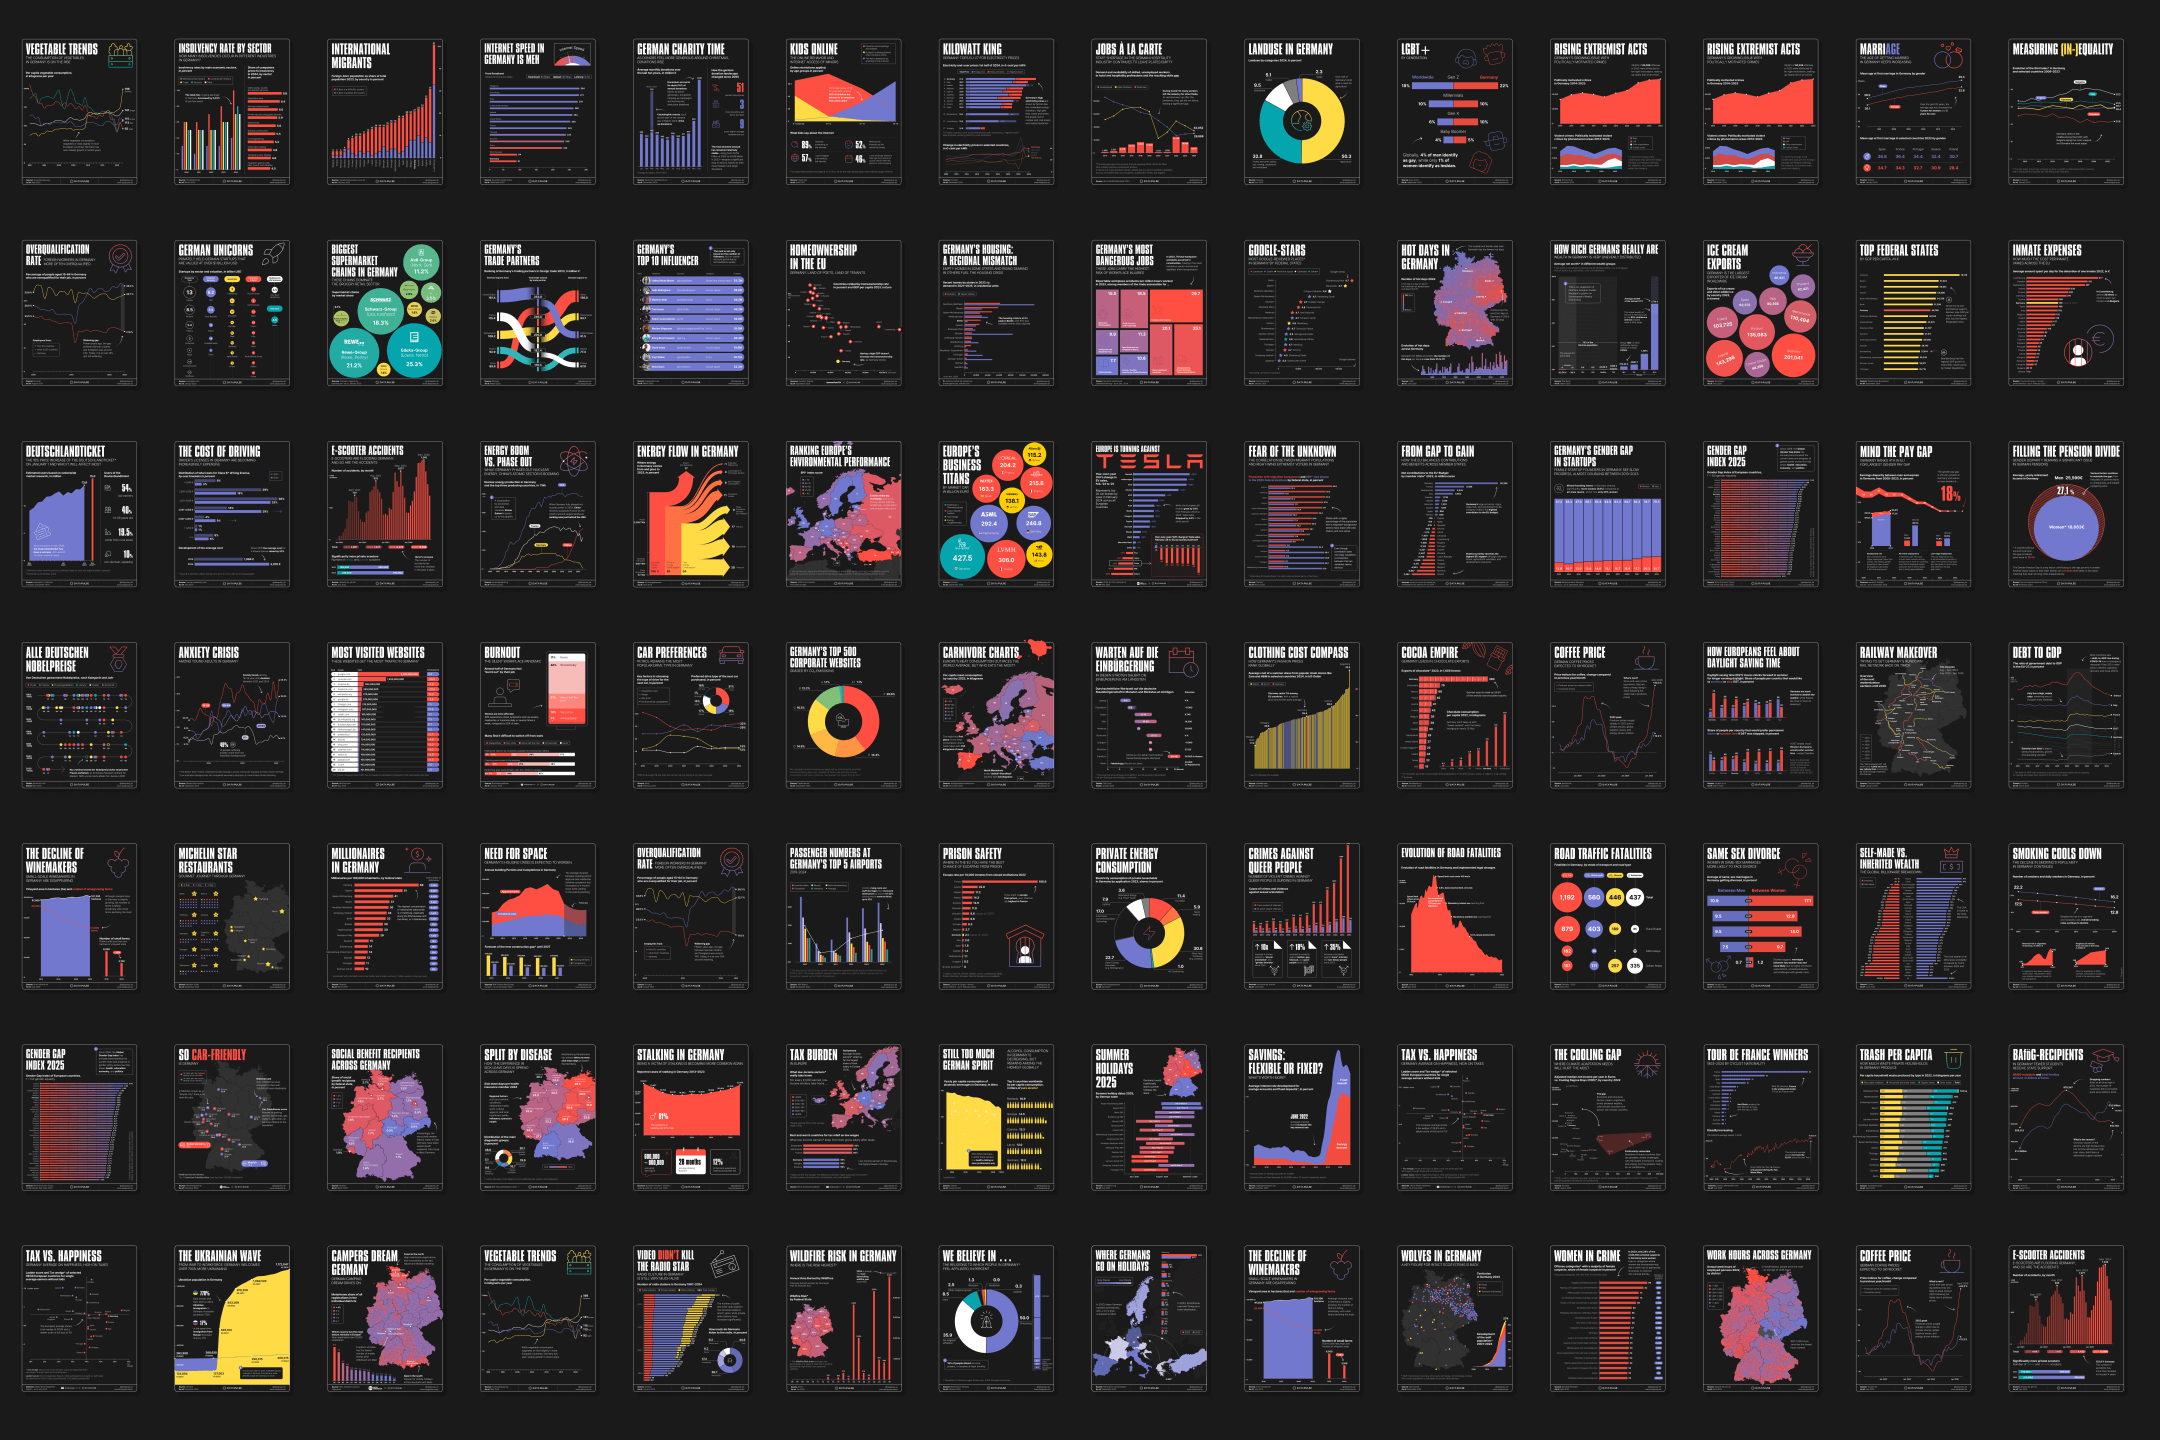
Collaboration with the media platform startup datapulse, supporting the development of their visual language as infographic editor by refining their style, and streamlining the production of weekly data graphics.
The content spans a wide range of topics, always centered around Germany.

Client

datapulse

Roles

artdirection

production

production

A chart showing the decline of small-scale winemakers in Germany from 2010 to 2024, with vineyard area slightly increasing from 97,008 to 101,300 hectares, but the number of farms decreasing from 20,290 to 14,000, and small farms dropping 48% from 6,050 to 3,160.
A chart displaying Nobel prizes won by Germans in different categories and years, with colored dots representing categories like Physics, Chemistry, Medicine, Literature, Peace, and Economics. The timeline spans from 1901 to 2021, showing patterns and notable years with multiple awards. Text highlights that only twice have German women received Nobel Prizes.
Map of Europe showing countries' per capita meat consumption in kilograms for 2022. Countries are color-coded from blue (<60 kg) to red (>100 kg). Spain has the highest at 105 kg, and North Macedonia is the 'animal-friendliest' with 42 kg.